Free Curriculum and Resources
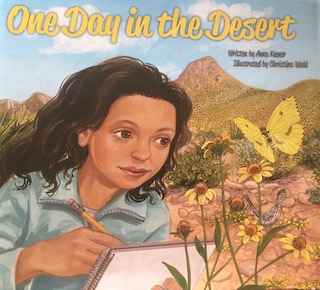
One Day in the Desert - Elementary Science Series
This module contains five activities: three interactive videos with instructions for hands-on activities and two optional assignments. The videos center on a guided reading of One Day in the Desert by Anna Keener. Students will follow Mariana and her classmates from Las Cruces, New Mexico as they take a field trip and learn about the unique plants, animals, history, and other features of the Chihuahuan Desert.
Climate Change
Asombro works with the USDA Southwest Climate Hub to create hands-on, standards-aligned lessons for students.
10-hour Unit
Target audience: 6th-12th Grade Students
Increased temperatures and altered precipitation will make water, a limited resource in the arid southwestern United States, even scarcer in many locations. With the aim of fostering climate literacy in our future citizens, we partnered with the USDA Southwest Climate Hub to create an engaging, fun, and scientifically rigorous education unit that is aligned with Common Core State Standards and Next Generation Science Standards.
5-hour Unit
Target Audience: 6th-12th Grade Students
As the climate changes, increased temperatures and extreme events are predicted in the southwestern United States, which could impact crop productivity and food security. We partnered with the USDA Southwest Climate Hub to design an engaging, fun, and scientifically rigorous education unit aligned with Common Core State Standards and Next Generation Science Standards.
3-hour Unit
Target Audience: 9th-12th Grade Students
This unit was designed to introduce 9-12th grade students to climate change, the carbon cycle, and the effects of increasing atmospheric carbon dioxide on Earth’s climate. We partnered with the USDA Southwest Climate Hub to design this rigorous high-school level education unit aligned with Common Core State Standards and the three dimensions of the Next Generation Science Standards.
45-minute Lesson
Target Audience: 6th-8th Grade Students
In this standalone lesson, students will interpret graphs to explore the causes of water shortages in the Southwestern United States and predict future conditions. They watch a video about traditional and current water conservation methods and then design, build, and test their own water conservation system. This lesson can be completed in-class, remotely, or as a homework assignment with suggested modifications.
5-hour Unit
Target Audience: 9th-12th Grade Students
This unit was designed to introduce 9-12th grade students to the effects of climate change on wildfire in the Southwest. We partnered with the USDA Southwest Climate Hub to design this rigorous high-school level education unit aligned with Common Core State Standards and the three dimensions of the Next Generation Science Standards.
5+ hour Unit
Target Audience: 6th-12th Grade Students
This unit was designed to introduce 6-12 grade students to the effects of climate change on water resources and inspire them to take action based on data. We partnered with the USDA Southwest Climate Hub to design an engaging, fun, and scientifically rigorous education unit aligned with Common Core State Standards and Next Generation Science Standards. This unit is freely available and intended for use by anyone, especially educators of 6-12 grade students. The unit consists of several designed to be conducted over five or more days. However, there are many stopping points and the unit need not be completed in its entirety.
Two 45-Minute Lessons
Target Audience: 6th-12th Grade Students
Phenology is the study of the timing of natural patterns and life cycles. In these two standalone lessons, students explore the relationships between phenology and climate. In The Grass is Greener, middle school students explore desert phenology data and play a game to model how desert grasses and shrubs obtain water, explaining seasonal growth patterns. In Season Sawtooth Patterns, high school students explore online databases to correlate seasonal changes in CO2 with seasonal changes in photosynthesis.
Sustainable Southwest Beef
Asombro leads K-12 education efforts for this collaborative research project focused on novel strategies for sustainable beef production in the southwest.
After an introduction to traits and several types of cows, students visit six hands-on stations to gather data to compare a lost cow’s traits to the traits of other cattle types. They analyze and interpret these data to help a rancher reunite the lost cow with her herd.
Students are introduced to “virtual fencing,” a tool studied by scientists in the Sustainable Southwest Beef Project. After conducting hands-on tests of models of traditional and virtual fences, students evaluate the potential of virtual fences to help ranchers save time, money, and protect the environment.
This competitive game encourages players to think broadly, innovatively, and creatively. This is a game of divergent and innovative thinking, with a bit of luck. The game will be updated regularly by Asombro educators.
Students learn about heritage livestock as they play the roles of Angus and Raramuri Criollo cattle grazing on a rangeland under abundant and then limited forage conditions caused by climate change.
Students will evaluate one of three solutions that hold promise for creating more sustainable beef production in the southwest and present that solution.
Mini Data Jam - Middle and High School Data Challenge
Challenge your science, math, and creative skills! In this Mini Data Jam, we explain how to find trends in real scientific data and then turn your data trends into songs, models, crafts, and more to communicate your findings to others.
Students Using LandPKS to Share Data, Information, and Knowledge - Three Lesson Module for 5th - 8th Grade
Students participate in hands-on activities that introduce them to soil indicators. Working in groups, learners collect data on soil properties, land cover, and other characteristics of one or more sites in the schoolyard or local area. They then use the data they collected to generate Land Capability Classifications (LCCs) using the LandPKS app. Finally, students apply their new knowledge of LCCs to design a possible solution to a land management dilemma. The concepts and activities are also relevant for older students and adults.
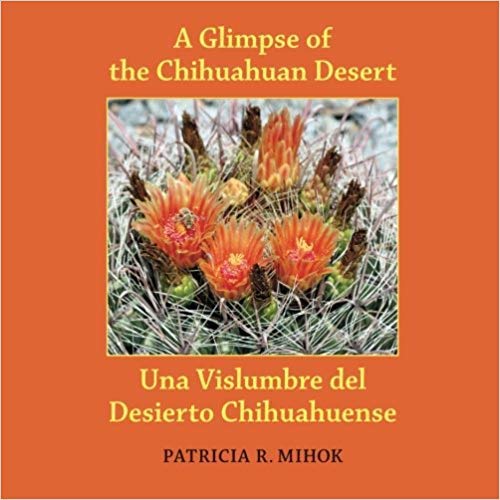
Glimpse of the Chihuahuan Desert - Materials for 4th - 5th grade
This 4th and 5th grade, English and Spanish language activity guide was developed by the Asombro Institute for Science Education. The seven hands-on activities are designed to accompany the bilingual book Glimpse of the Chihuahuan Desert by retired teacher and Asombro volunteer Patricia Mihok.
Every activity includes a teacher’s guide (with background information in both English and Spanish), Spanish student worksheets, English student worksheets, and answer keys with sample data. Activities are aligned with Next Generation Science Standards and Common Core State Standards. Asombro can loans kits of supplies to local teachers who would like to implement the activities with their classes. Please contact the Asombro office for more information.


